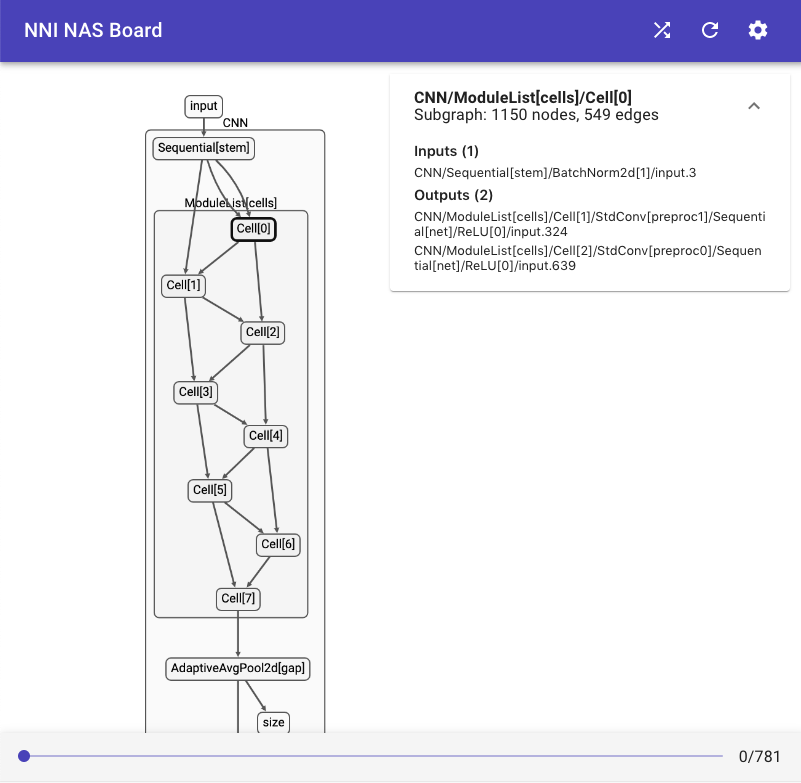
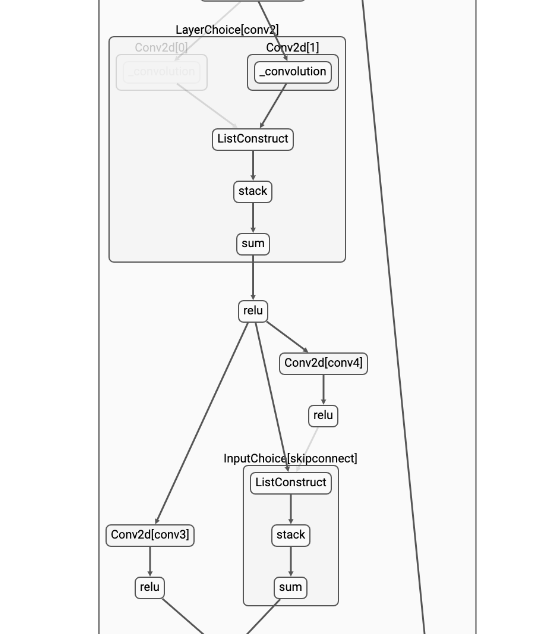
NAS Visualization (Experimental)
Built-in Trainers Support
Currently, only ENAS and DARTS support visualization. Examples of ENAS and DARTS has demonstrated how to enable visualization in your code, namely, adding this before trainer.train():
trainer.enable_visualization()
This will create a directory logs/<current_time_stamp> in your working folder, in which you will find two files graph.json and log.
You don’t have to wait until your program finishes to launch NAS UI, but it’s important that these two files have been already created. Launch NAS UI with
nnictl webui nas --logdir logs/<current_time_stamp> --port <port>
Visualize a Customized Trainer
If you are interested in how to customize a trainer, please read this doc.
You should do two modifications to an existing trainer to enable visualization:
- Export your graph before training, with
vis_graph = self.mutator.graph(inputs)
# `inputs` is a dummy input to your model. For example, torch.randn((1, 3, 32, 32)).cuda()
# If your model has multiple inputs, it should be a tuple.
with open("/path/to/your/logdir/graph.json", "w") as f:
    json.dump(vis_graph, f)
- Logging the choices you’ve made. You can do it once per epoch, once per mini-batch or whatever frequency you’d like.
def __init__(self):
    # ...
    self.status_writer = open("/path/to/your/logdir/log", "w")  # create a writer

def train(self):
    # ...
    print(json.dumps(self.mutator.status()), file=self.status_writer, flush=True)  # dump a record of status
If you are implementing your customized trainer inheriting Trainer. We have provided enable_visualization() and _write_graph_status() for easy-to-use purposes. All you need to do is calling trainer.enable_visualization() before start, and trainer._write_graph_status() each time you want to do the logging. But remember both of these APIs are experimental and subject to change in future.
Last but not least, invode NAS UI with
nnictl webui nas --logdir /path/to/your/logdir
Limitations
- NAS visualization only works with PyTorch >=1.4. We’ve tested it on PyTorch 1.3.1 and it doesn’t work.
- We rely on PyTorch support for tensorboard for graph export, which relies on
torch.jit. It will not work if your model doesn’t supportjit. - There are known performance issues when loading a moderate-size graph with many op choices (like DARTS search space).
Feedback
NAS UI is currently experimental. We welcome your feedback. Here we have listed all the to-do items of NAS UI in the future. Feel free to comment (or submit a new issue) if you have other suggestions.